Beschreibung
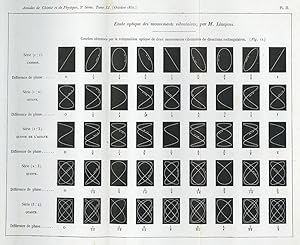
Lissajous Figures: Inscribed Presentation Copy of the Very Rare Offprint Lissajous, Jules Antoine (1822-80). Memoire sur l'Etude optique des mouvements vibratoires. Offprint from Annales de chimie et de physique, 3rd series, 51 (1857). 8vo. 87, [1]pp. 2 folding plates with tissue guards. Paris: Mallet-Bachelier, 1857. 223 x 147 mm. Plain green wrappers c. 1857, front wrapper with author's signed presentation inscription: "A Monsieur Vincent de l'Institut, Souvenir affectueux de l'auteur, J. Lissajous." First signature a bit browned, title a little soiled, scattered foxing especially on tissue guards, otherwise fine. 2 sheets ms. calculations laid in, probably by the recipient of the offprint. First Separate Edition. Lissajous's most comprehensive paper on his optical method of studying vibration, which gave rise to the widely used "Lissajous figures," defined mathematically as curves in the xy plane generated by the functions y = a sin (w1t + q1) and x = b sin (w2t + q2) where w1 and w2 are small integers. "Like some other physicists of his time, Lissajous was interested in demonstrations of vibration that did not depend on the sense of hearing. . . . [His] most important research, first described in 1855, was the invention of a way to study acoustic vibrations by reflecting a light beam from the vibrating object onto a screen. . . . Lissajous produced two kinds of luminous curves. In the first kind, light is reflected from a tuning fork (to which a small mirror is attached), and then from a large mirror that is rotated rapidly. . . . The second kind of curve, named the 'Lissajous figure,' is more useful. The light beam is successively reflected from mirrors on two forks that are vibrating about mutually perpendicular axes. Persistence of vision causes various curves, whose shapes depend on the relative frequency, phase, and amplitude of the forks' vibrations. . . . If one of the forks is a standard, the form of the curve enables an estimate of the parameters of the other. As Lissajous said, they enable one to study beats (the ellipses rotate as the phase difference changes). 'Lissajous figures' have been, and still are, important in this respect" (DSB). Lissajous figures are sometimes used in graphic design as logos. Examples include the logos of the Australian Broadcasting Corporation (a = 1, b = 3, d = p/2) and the Lincoln Laboratory at MIT (a = 4, b = 3, d = 0). Prior to modern computer graphics, Lissajous curves were typically generated using an oscilloscope. Two phase-shifted sinusoid inputs are applied to the oscilloscope in X-Y mode and the phase relationship between the signals is presented as a Lissajous figure. Lissajous curves can also be traced mechanically by means of a harmonograph. . Bestandsnummer des Verk�ufers 38038
Verk�ufer kontaktieren
Diesen Artikel melden


